Identifying Outliers in Data: A Comprehensive Guide
Learn about Z-score and IQR methods for detecting outliers in data analysis. Understand their workings, strengths, and weaknesses.

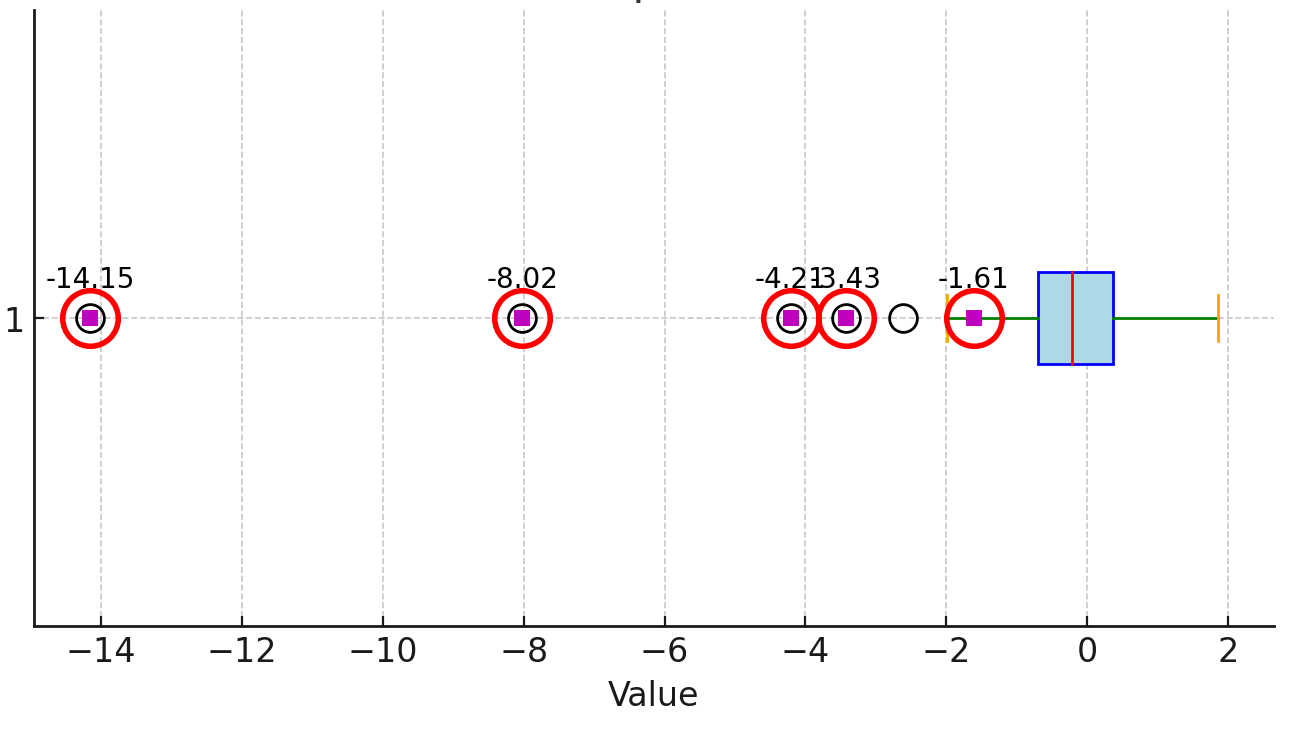
Outliers are data points that significantly deviate from the rest of the dataset, potentially indicating errors or unique phenomena worth investigating. Identifying outliers is crucial in data analysis as they can distort statistical analyses and lead to misleading conclusions. Two commonly used methods for detecting outliers are the Z-score method and the Interquartile Range (IQR) method. Each method has its strengths and weaknesses, and their applicability depends on the nature of the dataset.
Z-Score
The Z-score is a measure that tells us how far away a data point is from the mean (average) of the data set, in terms of standard deviations. Here's how it works:
- Mean: The average of all data points.
- Standard Deviation: A measure of how spread out the data points are from the mean.
- Z-score: This is calculated for each data point and shows how many standard deviations that point is from the mean. The formula for the Z-score is:𝑍=(𝑋−𝜇)𝜎Z=σ(X−μ)where 𝑋X is the data point, 𝜇μ is the mean, and 𝜎σ is the standard deviation.
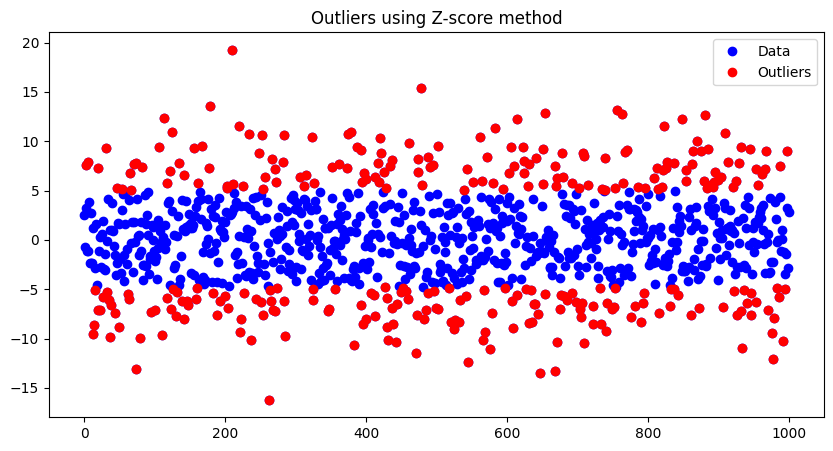
- Outliers: In this method, any data point with a Z-score greater than 3 or less than -3 is considered an outlier. This means the point is more than 3 standard deviations away from the mean, which is quite rare.
from scipy import stats
import numpy as np
import matplotlib.pyplot as plt


# Sample data
np.random.seed(42)
data = np.random.normal(0, 5, 1000)


# Calculating Z-scores
z_scores = stats.zscore(data)
outliers = np.where(np.abs(z_scores) > 3)

# Plotting data with outliers highlighted
plt.figure(figsize=(10, 5))
plt.plot(data, 'bo', label='Data')
plt.plot(outliers[0], data[outliers], 'ro', label='Outliers')
plt.title("Outliers using Z-score method")
plt.legend()
plt.show()

print("Outliers using Z-score method:", data[outliers])

Strengths:
- Suitable for normally distributed data: This method is very effective for identifying outliers in data that follows a normal distribution. It considers the mean and standard deviation to identify outliers.
- Quantifies the extremity: The Z-score provides a standardized measure, making it clear how extreme a data point is relative to the mean.
Weaknesses:
- Assumes normality: This method assumes that the data is normally distributed. If the data is highly skewed or has heavy tails, the Z-score method might not be appropriate.
- Sensitive to mean and standard deviation: Outliers can skew the mean and standard deviation, which can affect the Z-score calculation, especially in small datasets.
IQR Method
The Interquartile Range (IQR) method is a way to find outliers in a set of data. Outliers are data points that are much lower or higher than most of the other data points. Here’s how the IQR method works:
- Quartiles:
- Q1 (First Quartile): This is the value below which 25% of the data points fall.
- Q3 (Third Quartile): This is the value below which 75% of the data points fall.
- IQR (Interquartile Range): This is the range between Q1 and Q3. It's calculated as:IQR=𝑄3−𝑄1IQR=Q3−Q1
- Outlier Boundaries:
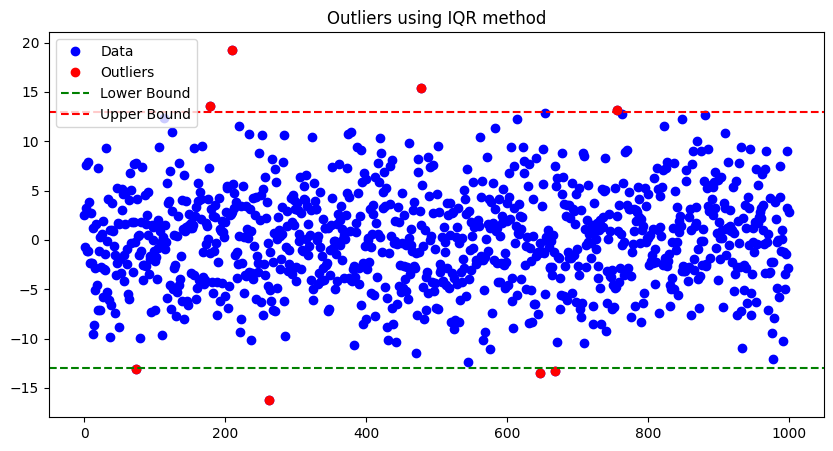
- Lower Bound: This is calculated as 𝑄1−1.5×IQRQ1−1.5×IQR. Any data point below this value is considered an outlier.
- Upper Bound: This is calculated as 𝑄3+1.5×IQRQ3+1.5×IQR. Any data point above this value is considered an outlier.
import numpy as np
import matplotlib.pyplot as plt

# Sample data
np.random.seed(42)
data = np.random.normal(0, 5, 1000)

# Calculating Q1, Q3, and IQR
Q1 = np.percentile(data, 25)
Q3 = np.percentile(data, 75)
IQR = Q3 - Q1

# Defining outlier bounds
lower_bound = Q1 - 1.5 * IQR
upper_bound = Q3 + 1.5 * IQR

# Identifying outliers
outliers = data[(data < lower_bound) | (data > upper_bound)]

# Plotting data with outliers highlighted
plt.figure(figsize=(10, 5))
plt.plot(data, 'bo', label='Data')
plt.plot(np.where((data < lower_bound) | (data > upper_bound))[0], outliers, 'ro', label='Outliers')

# Plotting upper and lower bounds
plt.axhline(y=lower_bound, color='g', linestyle='--', label='Lower Bound')
plt.axhline(y=upper_bound, color='r', linestyle='--', label='Upper Bound')

plt.title("Outliers using IQR method")
plt.legend()
plt.show()

print("Outliers using IQR method:", outliers)

Strengths:
- Non-parametric: This method does not assume any specific distribution for the data (e.g., normal distribution). It relies on the median and quartiles, making it robust to skewed data and outliers.
- Simple to understand and implement: The concept of quartiles and the IQR is straightforward and easy to calculate.
- Effective for small sample sizes: It can be more effective with small datasets where extreme values can skew the mean and standard deviation.
Weaknesses:
- May miss outliers in normally distributed data: It might not be as sensitive to outliers if the data is normally distributed, as it primarily focuses on the middle 50% of the data.
Choosing the Right Method
- Data Distribution:
- IQR Method: Use this method if your data is not normally distributed or if you have no information about the underlying distribution.
- Z-score Method: Use this method if your data is approximately normally distributed.
- Sample Size:
- IQR Method: Can be more reliable with smaller sample sizes.
- Z-score Method: More appropriate for larger datasets where the mean and standard deviation are more stable.
- Sensitivity to Extremes:
- IQR Method: Less sensitive to extreme values and more robust to skewed data.
- Z-score Method: More sensitive to extreme values, providing a precise measure of how extreme a value is.
Practical Example
Let's consider practical scenarios:
- Skewed Data: If you are analyzing house prices in a city, where there might be a few extremely high values (luxury homes), the IQR method would be more suitable as it is not influenced by these extreme values.
- Normally Distributed Data: If you are analyzing heights of adult men, where the distribution is likely to be normal, the Z-score method would be effective in identifying unusually short or tall individuals.
Conclusion
Both methods are useful tools in statistics for identifying outliers, and the choice of method depends on the characteristics of your data and the context of your analysis. Understanding the strengths and weaknesses of each method will help you make an informed decision on which method to use for your specific dataset.


