Intro to CNN (Convolutional Neural Network)
Learn the basics of Convolutional Neural Networks (CNNs) and how they process images through layers, from input to output.

Previously, we learned about neural network with python, now let’s move a bit towards CNN (Convolutional Network Network). So here is the plan of attack:
- Introduction
- What is CNN?
- How Does a CNN Work?
- Input
- Convolution
- Stride
- Padding
- Pooling
- Flattening
- Fully Connected Layers
- Output

Introduction
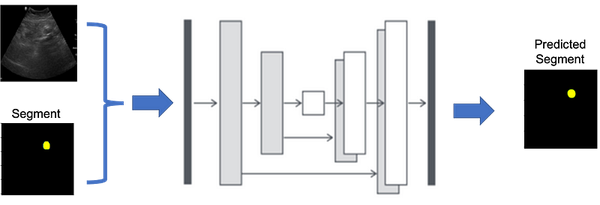
In the ever-evolving world of artificial intelligence and deep learning, Convolutional Neural Networks (CNNs) have become a cornerstone for various applications, especially in the field of computer vision. CNNs are powerful tools designed to mimic the human visual system and are exceptionally adept at recognizing patterns in images and videos. Today’s ResNets series, SAM, YOLOv8 etc. are build on CNN blocks. Figure 1 shows the example of CNN (Convolutional Neural Network).
What is CNN?
At its core, a Convolutional Neural Network is a type of artificial neural network, which means it’s a computational model inspired by the way the human brain processes information. However, CNNs are specialized for processing grid-like data, such as images making them particularly suitable for tasks like image recognition, object detection, and even medical image analysis.
How Does a CNN Work?
Let’s break down the basic steps of how a CNN works in a simple manner:
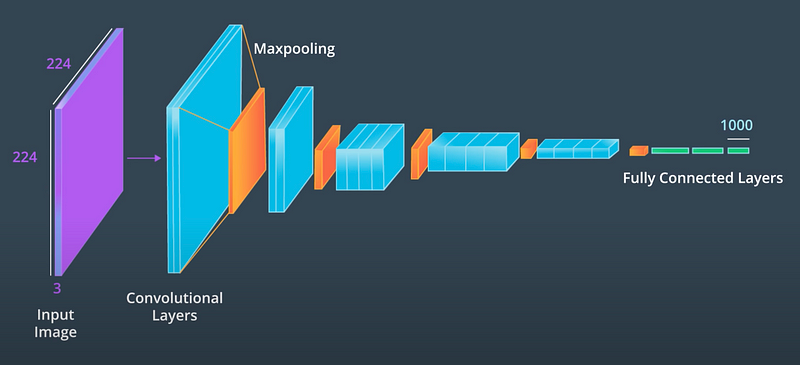
Input: The CNN starts with an input image or a grid-like dataset. Each pixel in the image is treated as a data point, and the CNN processes this data in a series of layers. When the input image is processed through the initial layer, it becomes evident that the first CNN layer has successfully identified certain features.
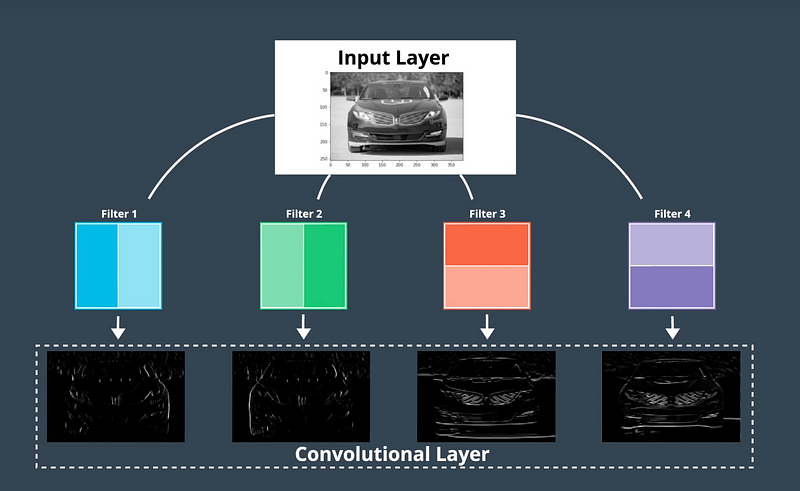
Convolution: In the first convolutional layer, a set of learnable filters is applied to the input image. These filters slide across the image and compute dot products, capturing various patterns and features. The result is a set of feature maps. In figure 3 (.gif), the image can be thought of as a matrix, and a filter moves across this image. Ultimately, the outcome is the convolved feature map.
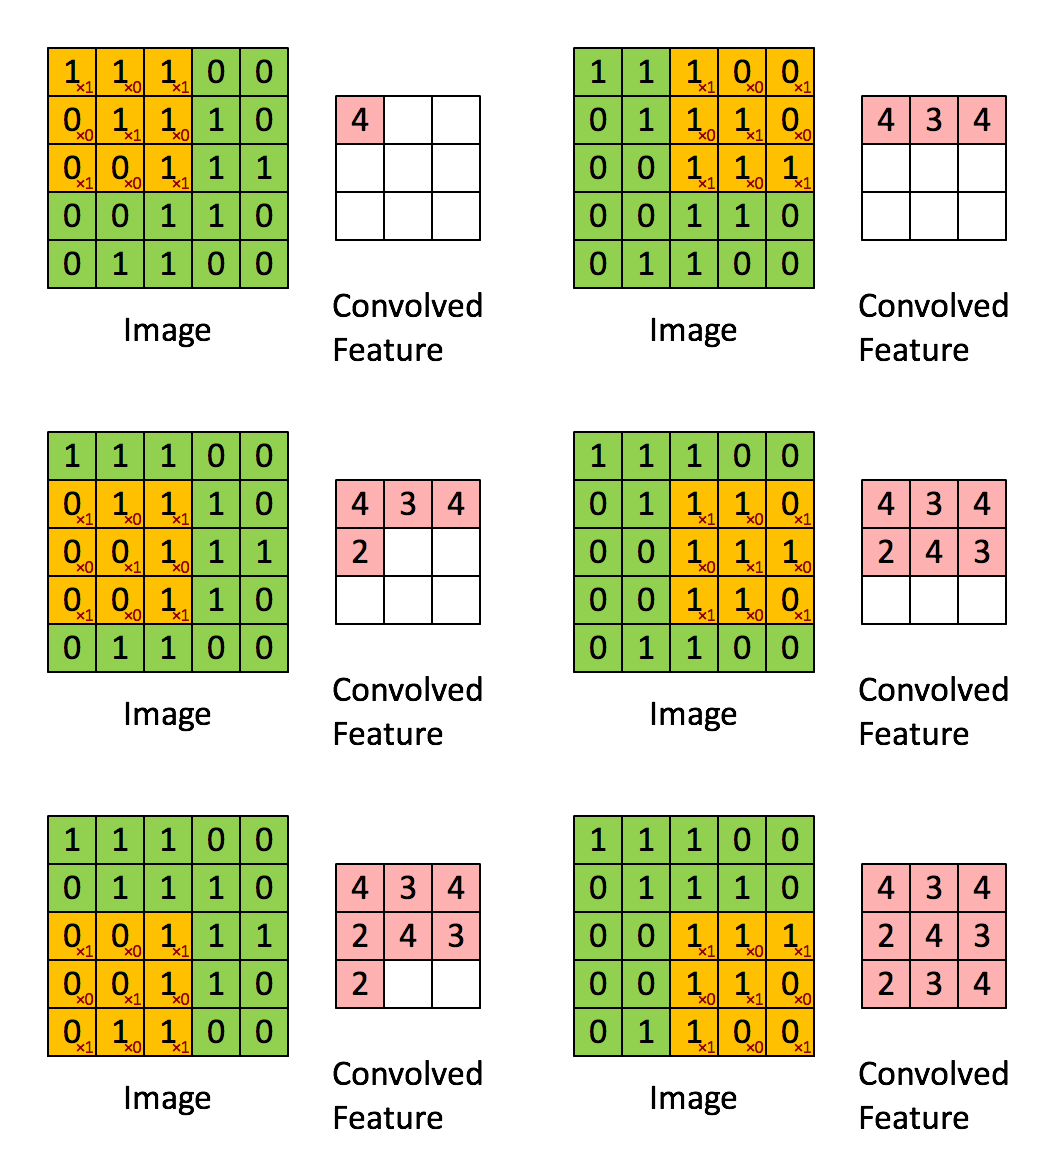
Figure 3 illustrates an example of a single filter, but it’s important to note that in a CNN layer, there are typically multiple filters at play. Figure 4 demonstrates the comprehensive process, followed by summation, and subsequently passing the result through the Rectified Linear Unit (ReLU) function.

Stride: In Figure 5, another important term to consider is “stride.” Stride determines how the filter moves across the image. If the stride is set to 1, the filter advances one step at a time. However, if the stride is set to 2, the filter moves two steps at a time. Typically, the value of stride is 1 commonly used in CNNs.

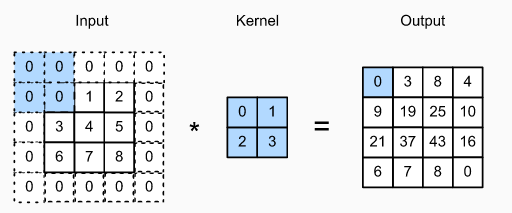
Padding: As shown in Figure 6, Padding in a Convolutional Neural Network (CNN) is the practice of adding extra rows and columns of zeros around the input image or feature map. It helps preserve the spatial dimensions of the input during convolution, preventing information loss and maintaining consistent output sizes, especially at the image edges.
Pooling: Next, pooling layers reduce the dimensions of the feature maps by selecting the most significant values, effectively downsampling the data. This step retains essential information while reducing computational load In Figure 7, it shows the max pooling layer.
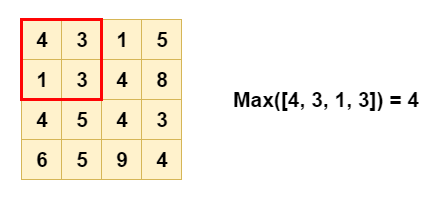
In figure 8, we can see the downsampling by maxpooling, if you see the after image size before and after there is a difference with image size.

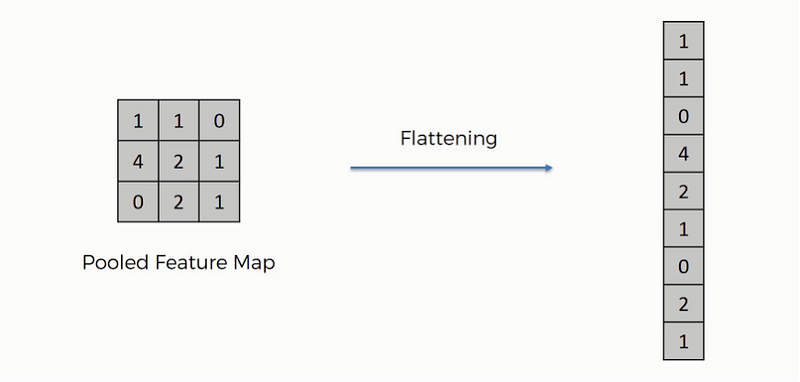
Flattening: The output from the convolution and pooling layers is then flattened into a one-dimensional vector. This vector serves as the input to the fully connected layers, as shown in Figure 9.
Fully Connected Layers: The fully connected layers process the flattened data, learning complex relationships between the extracted features. This process culminates in making predictions, such as identifying objects in an image or classifying an image into specific categories.
Output: The final layer provides the network’s prediction, which could be a class label, a bounding box, or a probability score. A final model can be represented like as shown in figure 10.

Thank you and happy learning 😄
